Oh my my, yeah I’m loving extra tuning time. ‘Cause I’m a sucker for Auto Tuning life.

A few weeks ago, we were talking to a new employee about how much time we spend with Query Store and they asked, “Why aren’t you using the Auto Tuning?”

THE WHAT NOW?!!!!

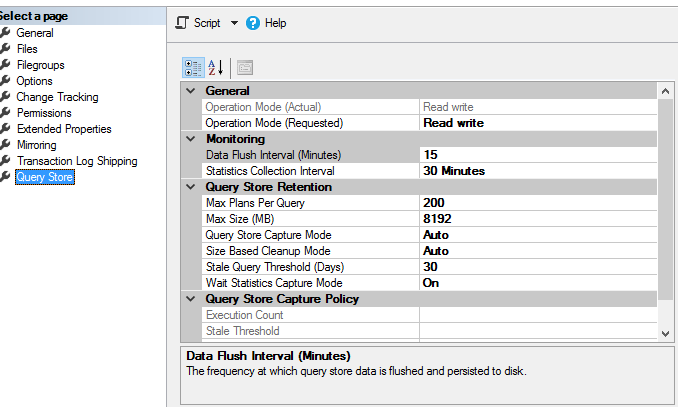
This awesome, Enterprise-only feature has been a bit of a trial and error for me.

Let’s start with turning it on, the only place I have found to turn it on is by using T-SQL:

ALTER DATABASE <DatabaseThatNeedsTuning> SET AUTOMATIC_TUNING ( FORCE_LAST_GOOD_PLAN = ON ); 

Now, there are a couple of cool things that we can check behind the scenes to see what is driving the auto-tuning. Once Auto-Tuning is enabled, it will collect information that can be viewed by running this query:

SELECT *
FROM sys.dm_db_tuning_recommendations

The first column (name) is the QueryID with “PR_” added to it. I like to read through the columns, the “reason” the plan was chosen, the current “state” of the plan. When it was initiated and when it was reverted, all of this is fun for me to dig through and see what plans my system is finding that are better.

I also really like the Microsoft example with the JSON:

SELECT reason, score,
      script = JSON_VALUE(details, '$.implementationDetails.script'),
      planForceDetails.*,
      estimated_gain = (regressedPlanExecutionCount + recommendedPlanExecutionCount)
                  * (regressedPlanCpuTimeAverage - recommendedPlanCpuTimeAverage)/1000000,
      error_prone = IIF(regressedPlanErrorCount > recommendedPlanErrorCount, 'YES','NO')
FROM sys.dm_db_tuning_recommendations
CROSS APPLY OPENJSON (Details, '$.planForceDetails')
    WITH (  [query_id] int '$.queryId',
            regressedPlanId int '$.regressedPlanId',
            recommendedPlanId int '$.recommendedPlanId',
            regressedPlanErrorCount int,
            recommendedPlanErrorCount int,
            regressedPlanExecutionCount int,
            regressedPlanCpuTimeAverage float,
            recommendedPlanExecutionCount int,
            recommendedPlanCpuTimeAverage float
          ) AS planForceDetails;

Now to the other stuff. It isn’t perfect. Sometimes I have to manually go in and pin plans that are better than what the system is finding. If I manually pin a plan, it will honor it and not unpin or try to find a better plan for that query. It has helped me spend a bunch less time on tuning, but since many of my servers are on Standard Edition I am still using Query Store a lot.

Happy Tuning!

The song for this post is Oh My My by Blue October

Query times just keep fallin’!

So if I can’t modify or add indexes and I can’t change code, how do I get my query times to drop? Query Store to the rescue.

I love to tune queries. I feel so satisfied to see the times dropping on my server as I tune things. Recently, I have been tracking my Batch Requests per Second and my Instance Waits to see if I am making improvements when I tune. It has been awesome!

What I am going to show you today is how I dig into my query store to find those misbehaving queries and make their performance better. First I go into a database’s properties to make sure my query store is turned on:

There are a ton of best practice posts on query store sizes and settings, we aren’t talking about that in this post. This is just an example of what it can look like with the most important part being the Operation Mode (Actual) at the top says “Read Write”.

If the query store was just barely turned on, give it at least 30 minutes to run before expecting it to show much. It may even take up to a day to get a good idea of what is happening.

My two favorite reports are Top Resource Consuming Queries and Regressed Queries.

I start by looking at the Top Resource Consuming Queries (I use the same process for Regressed Queries).

I will click on a bar in the chart and it will turn green. Then I will hit the “track query” button to the right of the “refresh” button just above the chart.

This query was more stable yesterday. I will look at all the plans available (I will even select “Configure” in the top right corner and change to look at a full month instead of the last day to see if I can find a better plan). I will then click the plan I like best and select the “Force Plan” button. SQL Server will verify the plan number and ask if I am sure, I check that it is the right one and then select “yes”. Next I will refresh until I see my newly pinned plan show up. If my plan doesn’t show up, but a new plan does, I will compare the new plan with the one I wanted. If they have the same shape, I know that is what SQL is putting in place for my forced plan and I will force the new one instead to keep it consistent.

Now I watch and see how the new forced plan behaves. If it goes horribly wrong, I will unforce it. If it is healthy and doing what I want, I move to the next query to see if I can help it.

Disclaimer: Query store won’t solve all the problems, but it can be a way to temporarily fix performance issues. I keep an eye on my pinned queries and make sure I watch for when changes hit the system. I also have alarms for when things start to run long so I can quickly diagnose performance issues. If Indexes are changed or code is modified, it can affect forced plans.

The song for this post is Fallin’ by Why Don’t We , it makes me want to dance every time I hear it.

Sometimes I get so high, so low, where did all my good plans go?

Greetings! Today I was playing with query store and noticed that I had some failing forced plans. How do you find failing forced plans? I asked this question over and over and finally found an answer.

I started on my main database and ran this query to look at query store:

SELECT *
FROM sys.query_store_plan
WHERE is_forced_plan = 1 and force_failure_count > 0

I had over 20 of them that were failing! Next, I had to figure out how to unforce the failing plans. Some of them were so old, they wouldn’t come up when I tried to look for them using the plan id in the GUI. I did more digging and found this:

EXEC sp_query_store_unforce_plan @query_id = Enter your queryid, @plan_id = Enter your planid

It was incredibly satisfying to watch each of the rows in the first query disappear as I ran them through the second query. This is now on my list of things to check so I can have a clean and healthy query store.

This post’s song is High Low by The Unlikely Candidates